About GRID
A map interface tool developed by UC San Diego Data Science students that detects San Diego Gas & Electric power poles through satellite imagery utilizing machine learning image recognition.
Github: https://github.com/papa-noel/map_user_interface
Introduction
Energy companies, like San Diego Gas & Electric, have the responsibility of ensuring that power is reliably and safely distributed. With Southern California being a historically fire prone region, it is even more essential that the utility company maintains its grid and minimizes the risk of fires caused by it’s equipment. SDG&E alone has thousands of miles of power lines supplying energy to millions of customers in its service territory that spans the San Diego and southern Orange counties. This makes the task of monitoring and maintaining utility equipment imperative not only for consistent electrical delivery, but for the safety of human lives and property.
This project seeks to develop a tool using satellite imagery and object detection to assist in this task, providing SDG&E with up-to-date and accurate imagery of their equipment and allowing them to identify potential risks on or around the equipment and make informed decisions based on the state of their utilities.
Methodology
Data Collection
In order to train an image recognition model that can identify electrical infrastructure from a satellite point of view, we collected image data of power line poles using the Google Static Maps API. This API is accessible and available for free up to a generous amount that is more than enough for the purpose of this project. With this, we were able to gather a significant number of images to use for our project. The API takes latitude and longitude coordinates as well as zoom to obtain the image data. The current training dataset consists of 101 satellite images around the San Diego area. Each image was then manually labeled using labeling tools, such as CVAT, and saved as a COCO json annotation file. When labeling, we made the decision to utilize the shadows of the poles as the primary identification point, so we ensure that the bounding boxes included not only the pole itself but also its visible shadow to improve the model’s detection ability.
Model Training
The model we used was Facebook’s DETR object detection model (DEtection TRansformer). This object detection framework, presented by Facebook AI at the European Conference on Computer Vision 2020 (ECCV), is simple but accurate, having efficient runtime performance. More information about this model can be found in their paper “End-to-End Object Detection with Transformers” (Carion et al., 2020). Using Facebook’s DETR model, we adapted it to incorporate our pole class, fine-tuning the model and training it with our image data that we collected. To train the model, the tagged image data was split into an 80/20 training and validation split and the model trained for 50 epochs. We then saved the model’s weights and specifications so that we could incorporate it into our user interface without having to retrain our model. The model training process can be found in our github repo: GRID-Object-Detection-Model.
Map Interface
For our user interface, we utilized Flask in order to create a website that would be able integrate our model with an interactive map. We embedded an interactive map using the Google Embed API, where users can navigate to any area and run our model in order to identify poles in the current view. Flask allowed us to integrate a script where PyTorch loaded our trained model and ran it on the current view.
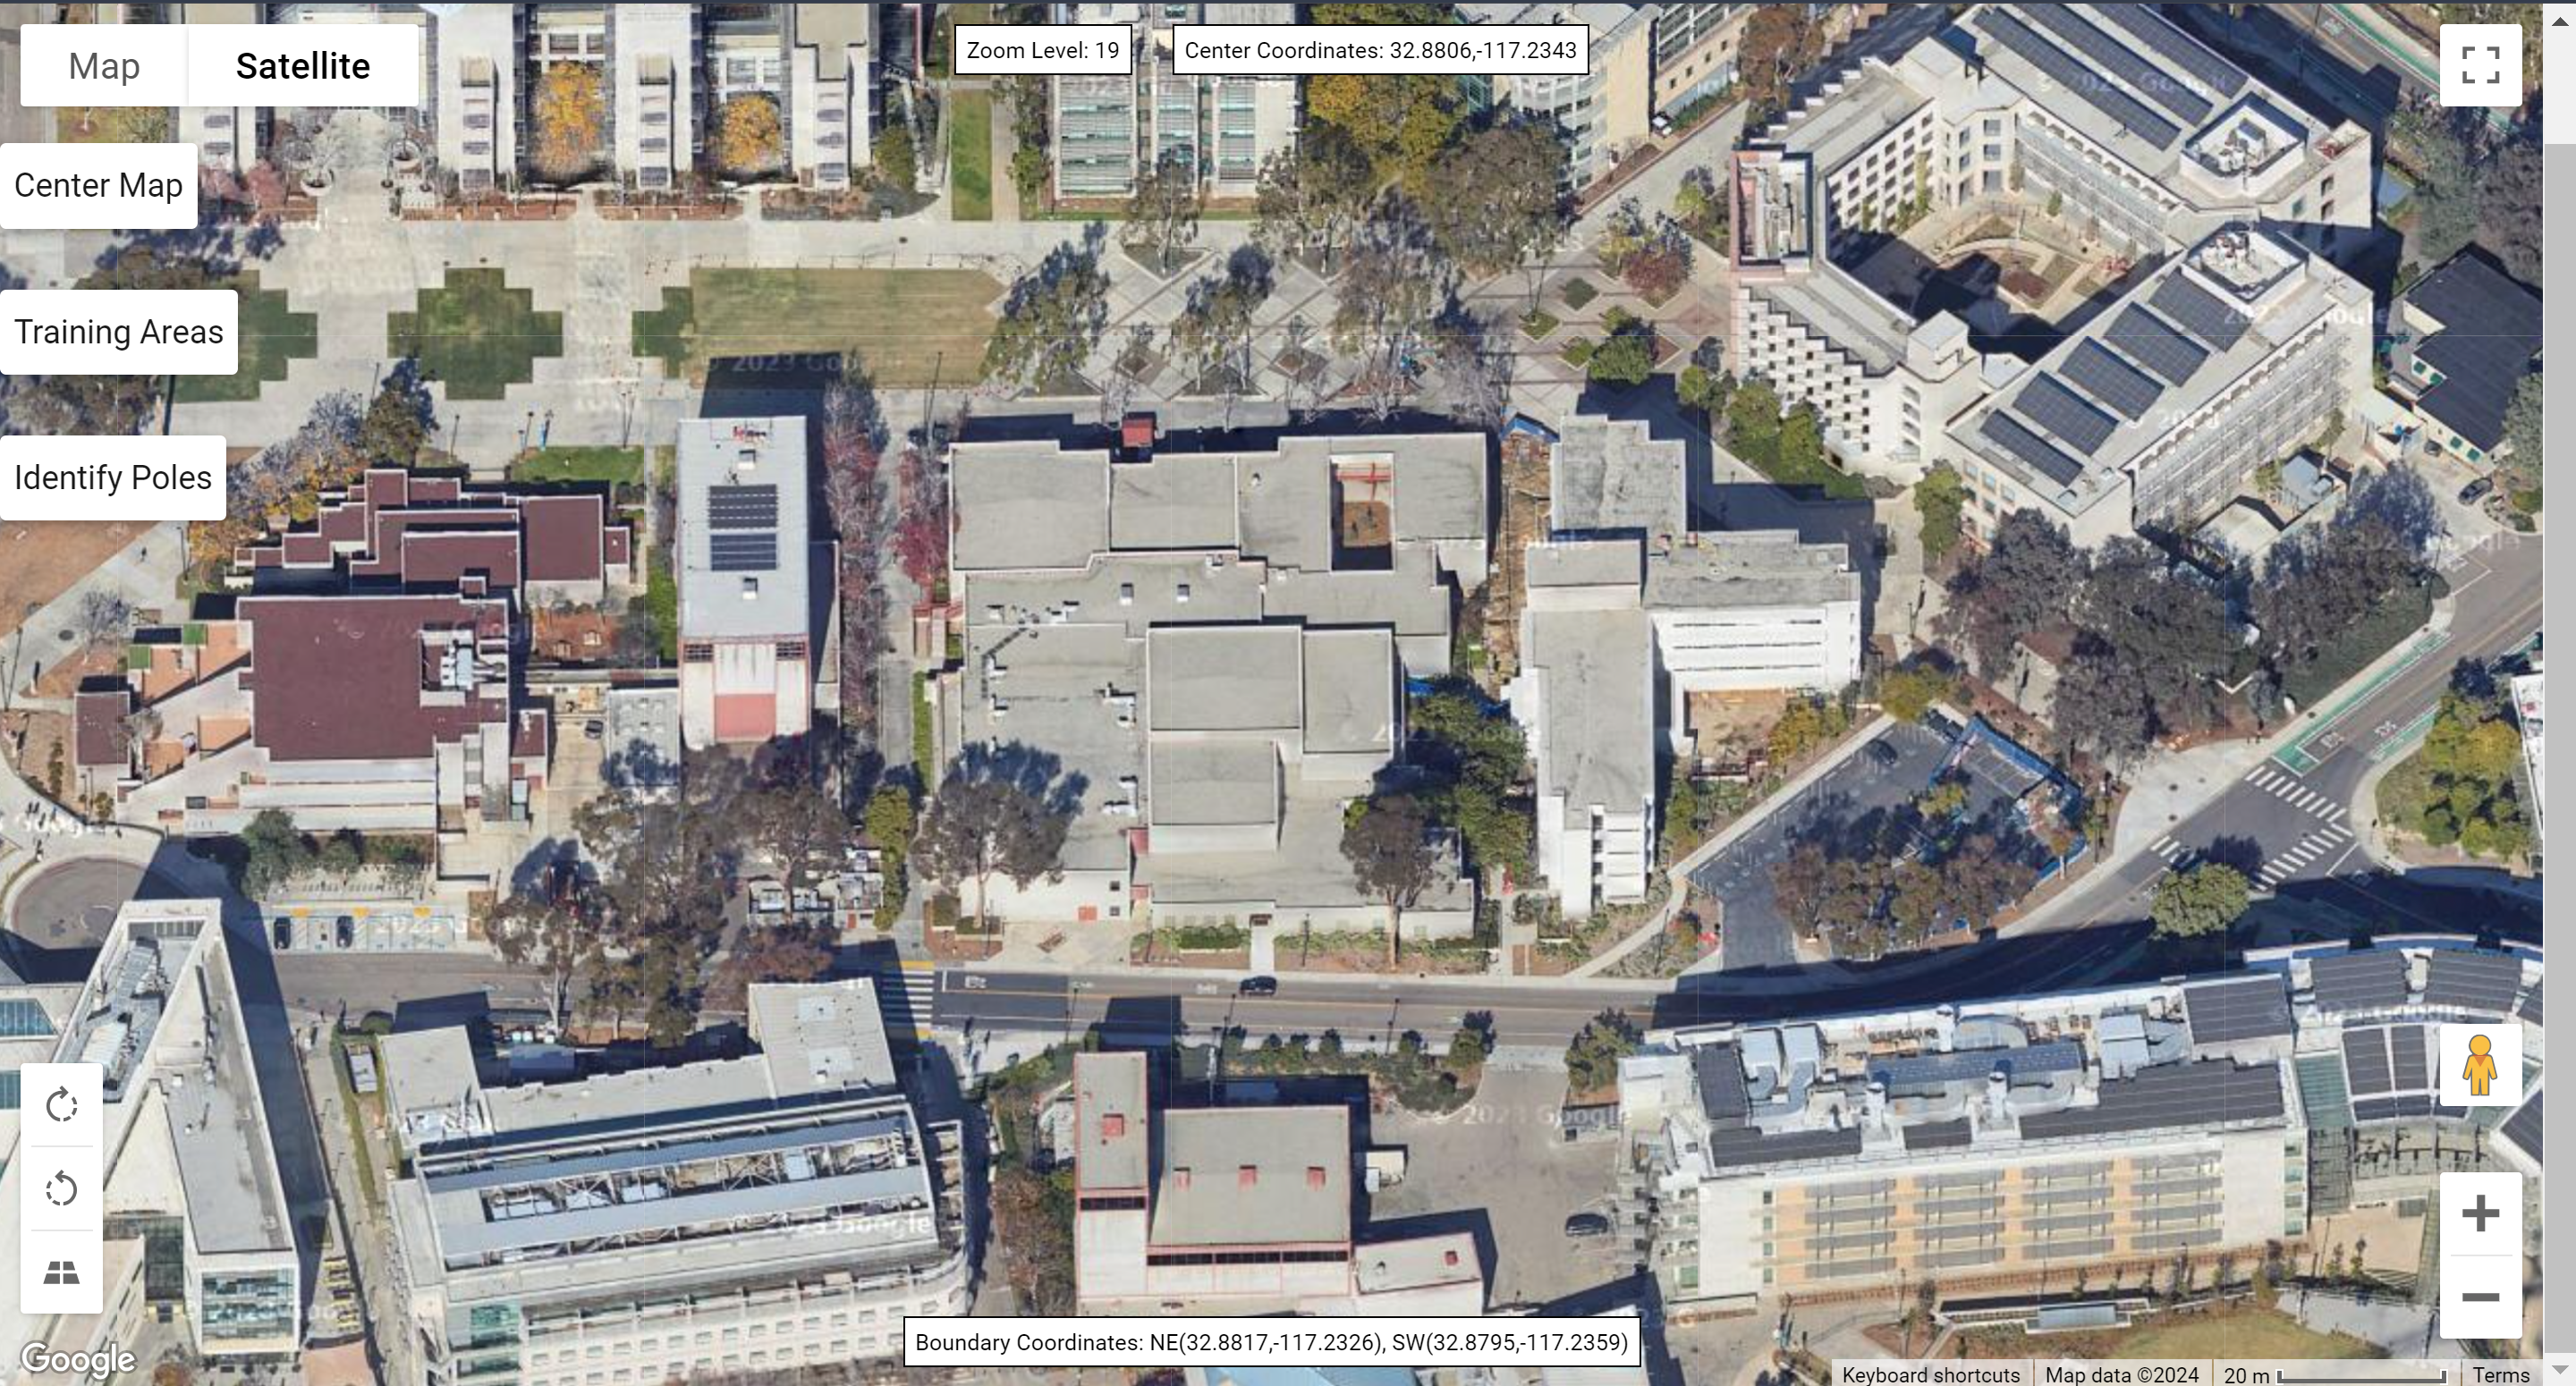 Figure 1: Map Interface Showing UCSD
Results
The model performs well, heavily relying on the shadow of the poles for object detection. As a result, the model has a high accuracy rate in detecting the poles with defined shadows. This can be seen in Figure 1 where every pole is identified and boxed.
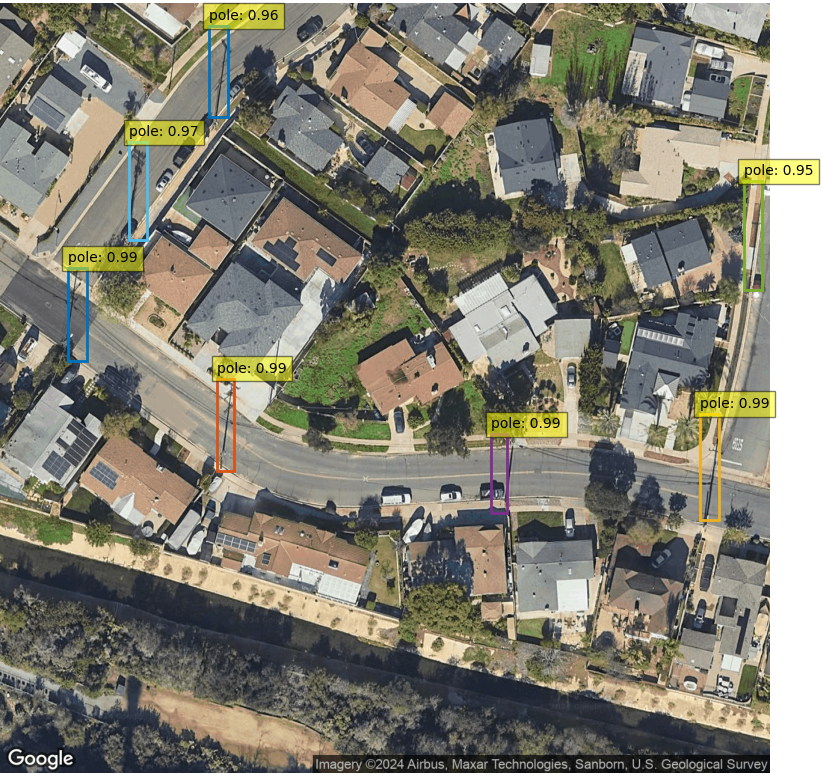 Figure 2
However, because the model heavily relies on the shadows, it can be easily fooled by shadows of palm trees and other objects. This can be seen in Figure 2 where the model incorrectly detects a fence line as a pole.
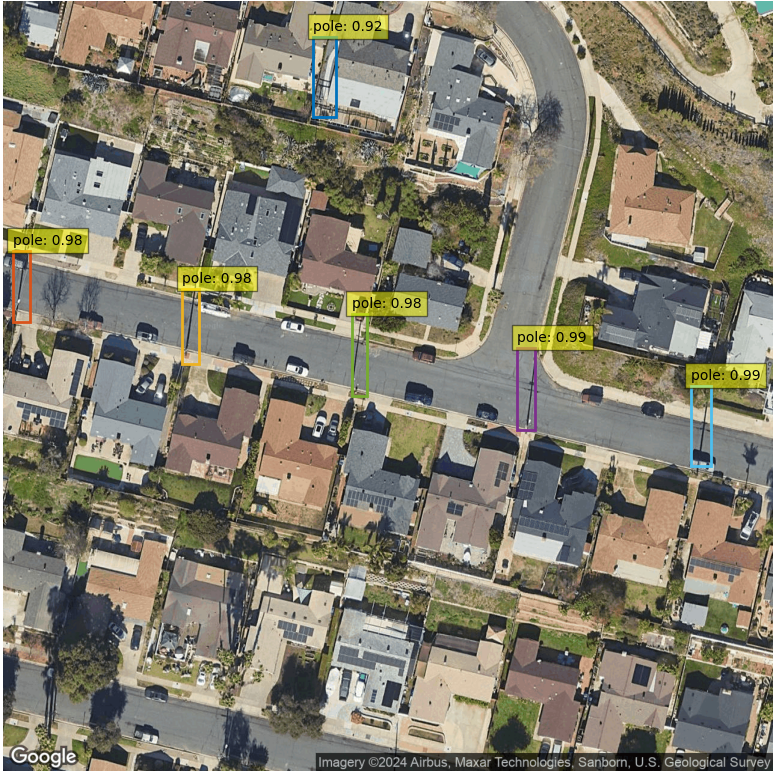 Figure 3
While further work needs to be done to improve our model, the concept remains the same. By detecting poles, this tool can help SDG&E keep track of their assets. Through the satellite view perspective, it allows SDG&E to monitor poles and identify potential hazards more easily across their service territory.
Conclusion
Energy companies like SDG&E are responsible for distributing electricity throughout the country, and so keeping track of utilities such poles is important. To carry this out, we trained a DETR model on labed satellite images of poles which achieved fairly accurate results in identifying other poles from Google Map’s satellite view. Our model performs well within San Diego County, however, we believe that our model can still be further improved with more labeled training images. Furthermore, labeled training images from other parts of the US would also add more accuracy and reliability when using the model outside of San Diego County.
We hope that this project demonstrates the usefulness that satellite imagery has for utility companies and that this project can be expanded upon to assist utility companies in their responsibilities of maintaining their assets, eliminating fire risks, and safely providing power to their customers.